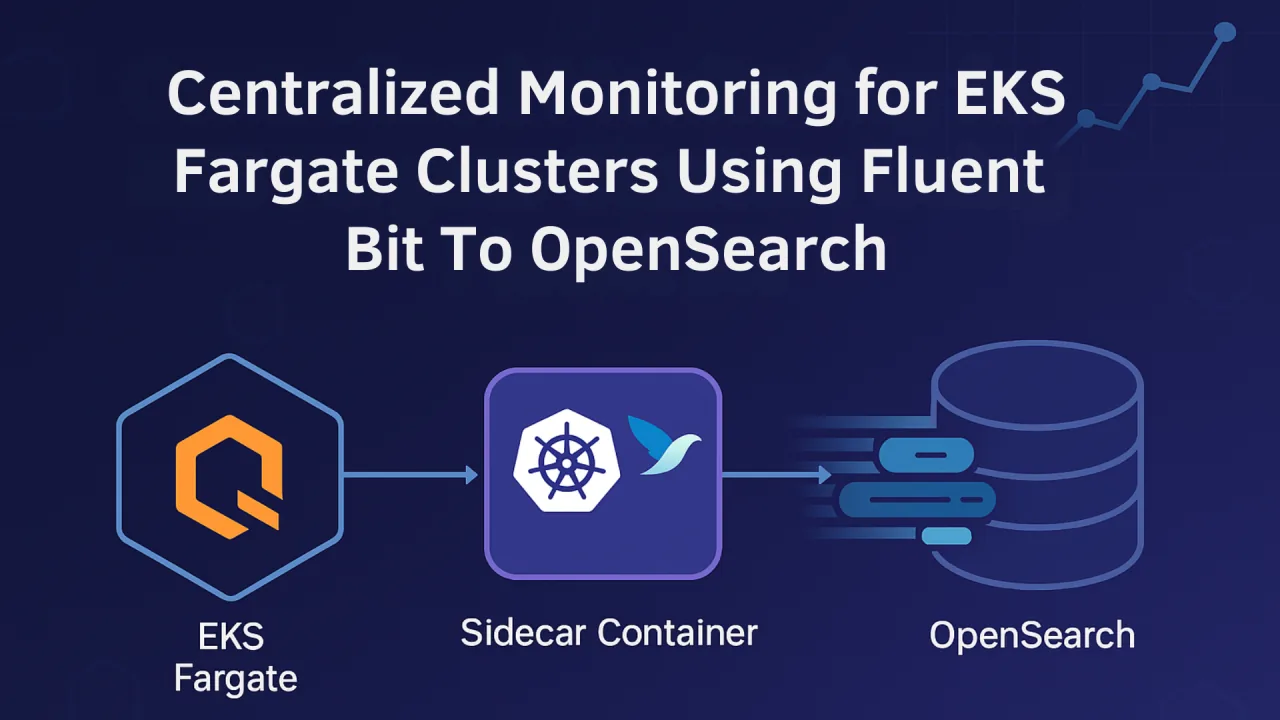
Centralised monitoring is essential for maintaining visibility, troubleshooting efficiently, and optimising performance in cloud-native environments. In this article, we walk through how SharkOps engineers deploy Fluent Bit as a sidecar container inside an EKS Fargate cluster to improve log collection and forwarding into OpenSearch — without the operational burden of managing log agents on every node.
Why Fluent Bit on EKS Fargate?
EKS Fargate runs pods on serverless compute — there are no EC2 nodes you control, and therefore no DaemonSet to deploy a node-level log collector. The native Fargate log router supports Fluent Bit as a managed sidecar pattern, which gives us a clean way to route container logs to OpenSearch, S3, Kinesis, or any supported output without owning the underlying infrastructure.
Fluent Bit is a great fit here because it is:
- Lightweight — written in C with a minimal memory footprint, ideal for sidecar deployments.
- Cloud-native — first-class support for Kubernetes metadata, AWS outputs, and Fargate.
- Pluggable — pipelines built from inputs, parsers, filters, and outputs with a simple configuration format.
Architecture Overview
The pattern is straightforward: each Fargate pod runs your application container alongside a Fluent Bit sidecar. Application stdout / stderr is read by Fluent Bit, processed through configurable pipelines, and shipped to OpenSearch using pod execution role credentials over the Fargate ENI — where it is indexed and made available to dashboards in OpenSearch Dashboards (formerly Kibana).
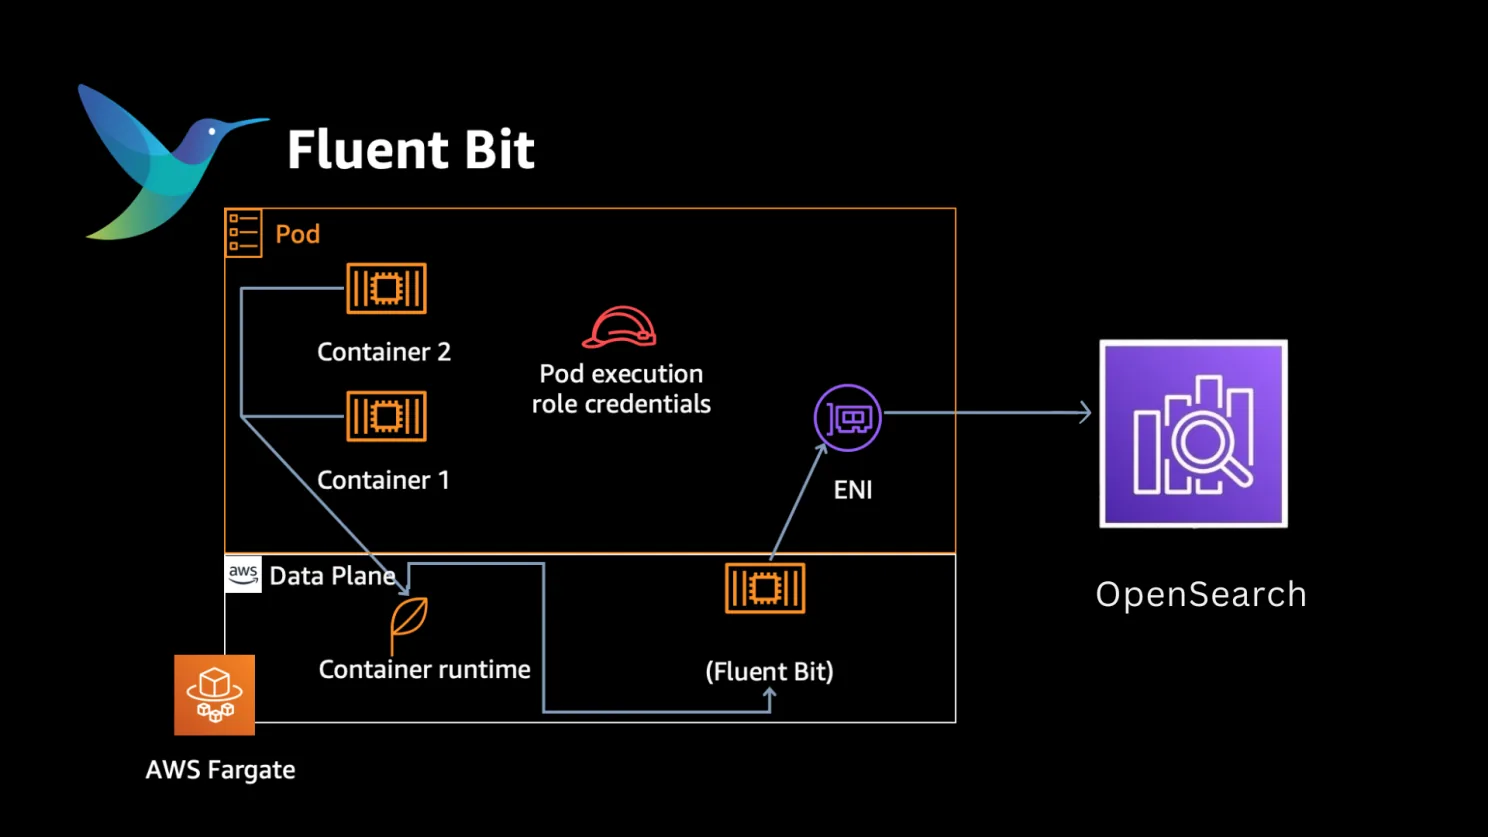
- EKS Fargate cluster runs serverless pods — no EC2 nodes to manage, so logging is shifted into the pod itself.
- Application containers (Container 1, Container 2 …) write logs to stdout/stderr inside the pod.
- Fluent Bit sidecar deployed alongside the app containers reads logs from the container runtime via the Fargate data plane.
- Pod execution role credentials are used to authenticate egress traffic from Fluent Bit to AWS services.
- OpenSearch receives logs over the pod ENI, indexes them in a Logstash-compatible format, and serves them to OpenSearch Dashboards.
Key components of the solution:
- Fluent Bit — a lightweight log processor and forwarder that collects logs from containers.
- Sidecar deployment — Fluent Bit runs as a sidecar container for every service in each namespace so logs are captured at the pod level.
- Custom configurations — namespace-level ConfigMaps hold the Fluent Bit configuration and parser definitions.
- OpenSearch — our log storage and analysis platform, which receives logs in a Logstash-compatible format.
Fluent Bit ConfigMap
We use a namespace-level ConfigMap to ship a common Fluent Bit configuration to every service deployed in that namespace. Sensitive values are replaced with placeholders so you can adapt them to your environment.
apiVersion: v1
kind: ConfigMap
metadata:
  name: fluentbit-config
  namespace: <your-namespace>
data:
  fluent-bit.conf: |
    [SERVICE]
        Flush               5
        Log_Level           info
        Parsers_File        /fluent-bit/etc/parsers/parsers.conf

    [INPUT]
        Name                tail
        Path                /var/log/containers/app.log
        Parser              <your-parser-name>
        Tag                 kube.*
        Mem_Buf_Limit       5MB
        Skip_Long_Lines     On
        Refresh_Interval    10
        Path_Key            file

    [FILTER]
        Name                record_modifier
        Match               kube.*
        # Inject metadata from environment variables or Kubernetes annotations
        Record              namespace ${FLUENT_NAMESPACE}
        Record              service   ${FLUENT_SERVICE}

    [OUTPUT]
        Name                opensearch
        Match               kube.*
        Host                <your-opensearch-endpoint>
        Port                443
        TLS                 On
        HTTP_User           <your-username>
        HTTP_Passwd         <your-password>
        Logstash_Format     On
        Logstash_Prefix     <your-logs-prefix>
        Logstash_DateFormat %Y.%m.%d
        Suppress_Type_Name  On
What each section does
- [SERVICE] — basic Fluent Bit parameters: log level and parser file location.
- [INPUT] — tails the container log file. A generic
kube.*tag lets the downstream filters match these logs. - [FILTER] record_modifier — adds custom metadata (like namespace and service) to each log entry. In our deployment, these are injected via environment variables on the Fluent Bit sidecar.
- [OUTPUT] — forwards logs to OpenSearch in a Logstash-compatible format. Replace placeholder values with your endpoint, credentials, and index prefix.
Fluent Bit Parser Configuration
The parser ConfigMap defines how Fluent Bit interprets the structure of incoming log lines. The example below handles JSON-formatted application logs.
apiVersion: v1
kind: ConfigMap
metadata:
  name: fluentbit-parsers
  namespace: <your-namespace>
data:
  parsers.conf: |
    [PARSER]
        Name             <your-parser-name>
        Format           json
        Time_Key         time
        Time_Format      %Y-%m-%dT%H:%M:%S.%L
        Time_Keep        On
Decode_Field_As json log- [PARSER] — defines a parser for JSON logs.
- Time_Key & Time_Format — specifies which field holds the timestamp and the expected format.
- Decode_Field_As — decodes the
logfield as JSON when nested encoding is in play.
Deployment & Verification
1. Apply the ConfigMaps
Apply both ConfigMaps to the target namespace:
2. Deploy Fluent Bit as a Sidecar
In every application pod that needs centralized logging, add Fluent Bit as a sidecar container. Mount the Fluent Bit configuration and pass the metadata via environment variables:
env:
  - name: FLUENT_NAMESPACE
    valueFrom:
      fieldRef:
        fieldPath: metadata.namespace
  - name: FLUENT_SERVICE
    value: "<your-service-name>"
3. Restart Pods
Once all configurations are applied, roll the deployment so pods pick up the new configuration:
4. Verify
Check the Fluent Bit sidecar logs for any startup or shipping errors:
Then confirm in OpenSearch that documents are being indexed under the configured Logstash prefix.
IAM & Networking Permissions
Fargate pods need the right permissions and network reachability to write to your OpenSearch domain. We attach a policy to the pod execution role (and align the OpenSearch domain access policy) to allow the es:ESHttp* actions against the target index pattern.
- Pod execution role — allow
es:ESHttpPost,es:ESHttpPut. - OpenSearch domain policy — allow the role principal on the target ARN.
- VPC — for OpenSearch domains inside a VPC, ensure the Fargate subnet can reach the domain endpoint.
Visualising in OpenSearch Dashboards
Once data starts landing in the fargate-logs-* index pattern, create dashboards for the questions you actually ask during incidents:
- Error rate by service and version over time.
- Latency percentiles parsed from structured logs.
- Top error messages with example log lines.
- Pod restart and OOM signals.
Lessons from Production
A few hard-won tips from our deployments:
- Always use structured JSON logs from the application — it makes parsing, filtering, and aggregation in OpenSearch dramatically simpler.
- Set index rollover and retention via ISM policies; uncapped log retention will surprise you on the storage bill.
- Tag logs with environment and version as Fluent Bit record modifiers — this makes blast-radius analysis trivial during incidents.
- Alert on log volume anomalies, not just on errors — a sudden silence is often the first signal of a broken collector.
Closing Thoughts
EKS Fargate + Fluent Bit + OpenSearch is a clean, low-maintenance pattern for teams that want centralised observability without running their own log collection fleet. It scales naturally with your workloads, plays nicely with AWS-native security, and gives engineers a single pane of glass during incidents.
If you're rolling this out across multiple clusters or accounts, our SRE team helps platform groups standardise this pattern and integrate it with downstream tooling — get in touch via the contact page if you'd like a hand.